US Home Price Outlook – November 2023

Discover the latest trends in the US real estate market with our detailed analysis of home prices through September 2023 and forecasts through September 2024.
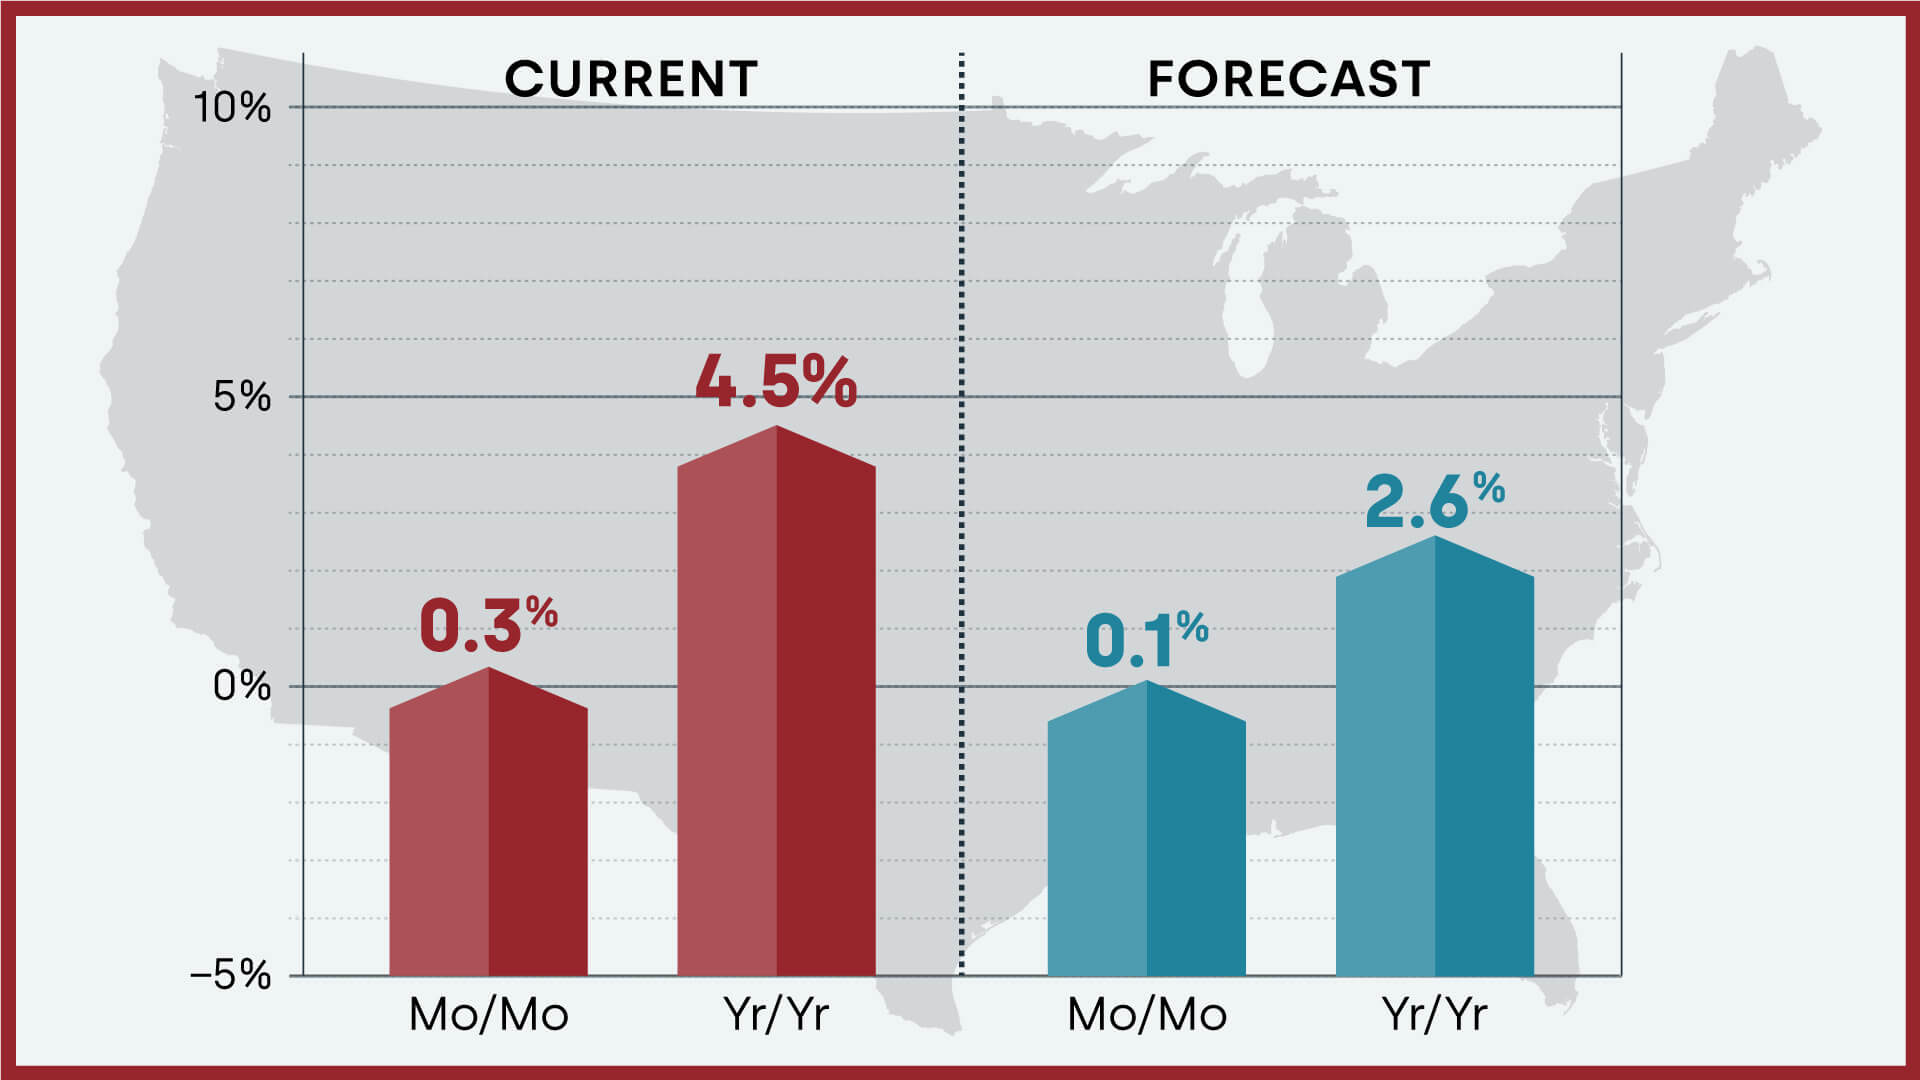
In September 2023, home prices nationwide, including distressed sales, increased by 4.5% compared to September 2022. Month over month, home prices increased by 0.3% in September 2023 compared to August 2023 (revisions with public record data are standard and, to ensure accuracy, CoreLogic incorporates newly released public data to provide updated results).
National Price Forecast
The CoreLogic Home Price Index Forecast indicates that home prices will increase by 0.1% from September 2023 to October 2023 and will increase by 2.6% year over year from September 2023 to September 2024.

Northeastern States Continue to Record the Highest Annual Home Price Increases in September
U.S. single-family home prices rose 4.5% year-over-year in September, the largest increase since February. The Northeast continued to record the strongest appreciation, with Maine experiencing a 10.1% annual increase, the first double-digit increase recorded in any state since early 2023. Despite mortgage rates approaching 8%, inventory constraints and a healthy U.S. labor market should help maintain moderate but steady price growth in the coming year.
"While annual home price growth continued its third month of upward momentum in September, this is mostly due to a comparison with last year's lows, when prices began cooling off from double-digit growth in the fall of 2022. However, given the continued rise in borrowing costs in 2023, it is surprising to see how resilient home price growth has been in recent months, with the 0.3% month-over-month increase in September aligning with pre-pandemic trends. Nonetheless, as mortgage rates significantly impact affordability, certain markets with ongoing migration from more expensive states are showing renewed dynamism and disproportionate monthly gains."
Selma Hepp
– Chief Economist at CoreLogic
National and State Home Price Index Maps – September 2023
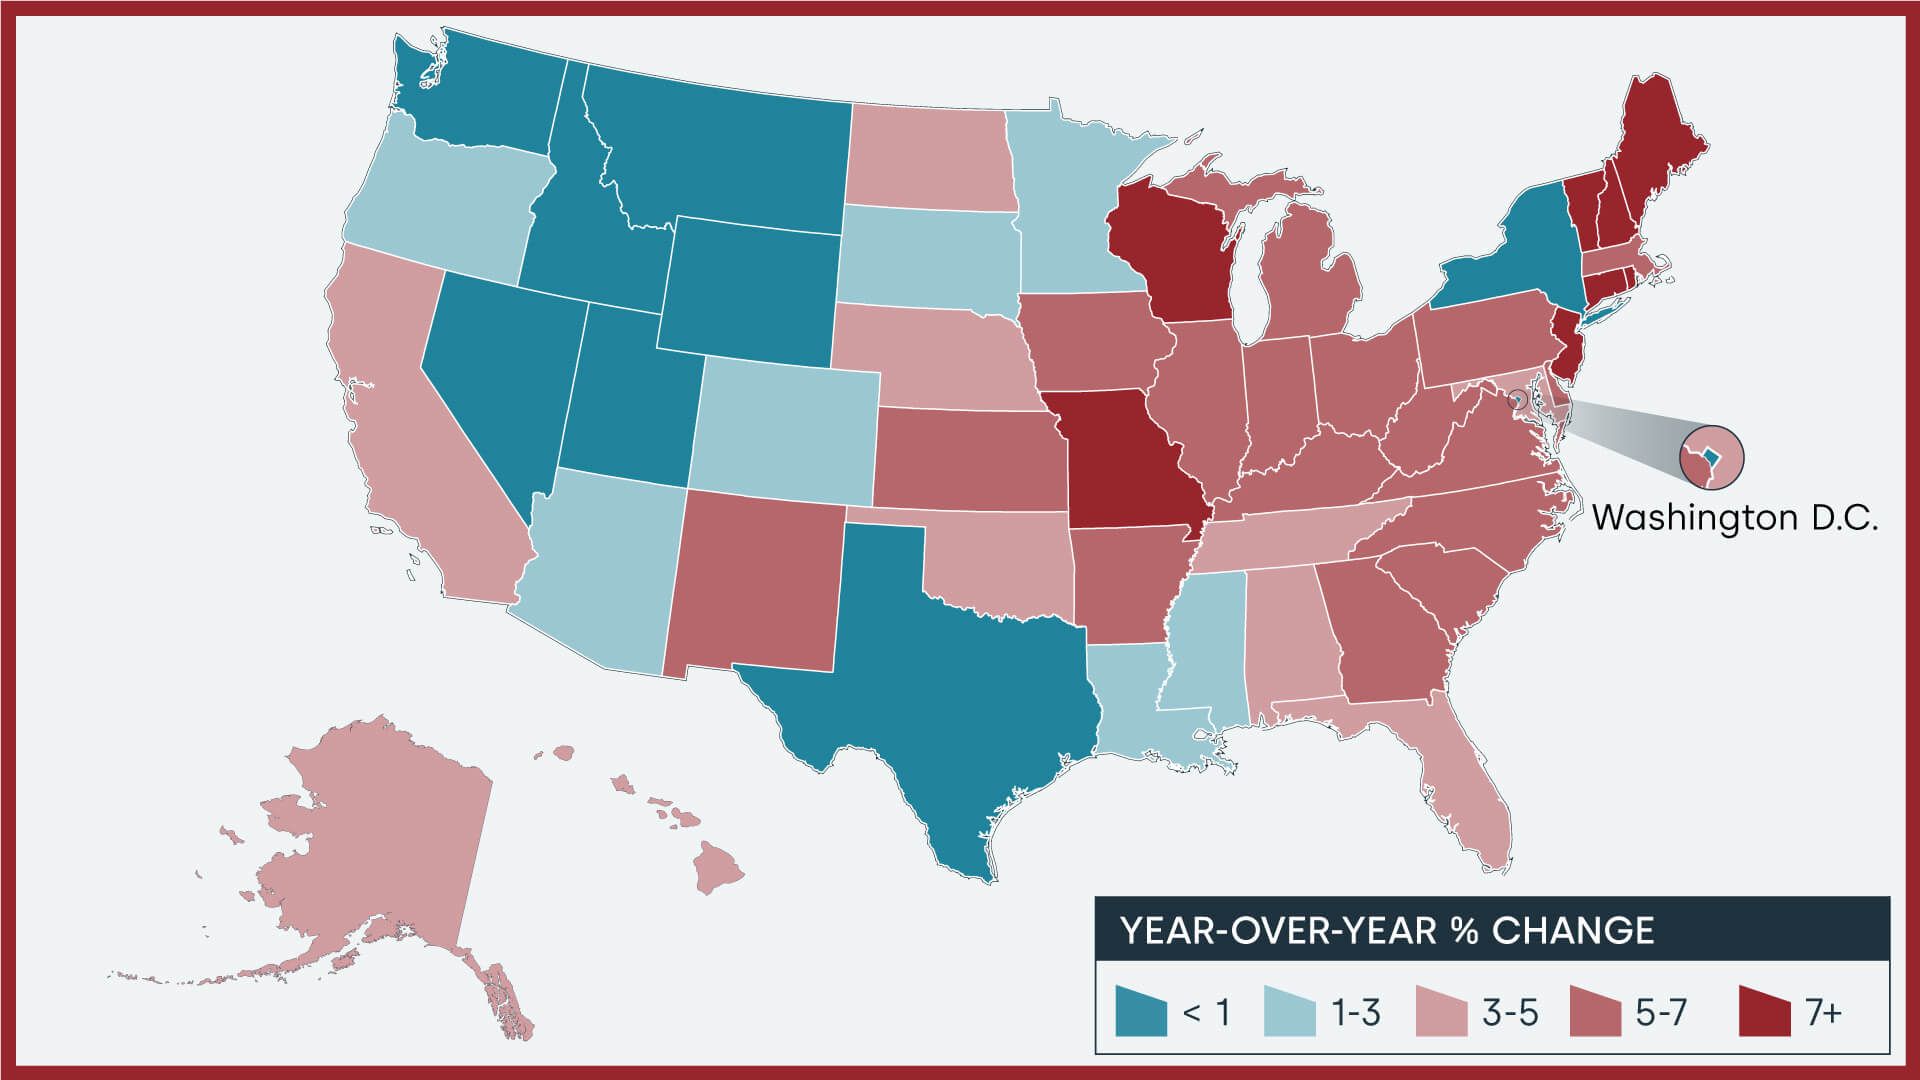
The CoreLogic Home Price Index provides measures for multiple market segments, known as tiers, based on property type, price, time between sales, loan type (conforming vs. non-conforming), and distressed sales. Broad national coverage is available from the national level to the ZIP code level, including non-disclosure states. Nationally, home prices increased by 4.5% year-over-year in September. Idaho, Montana, Utah, Washington D.C., and Wyoming experienced declines in home prices. The states with the largest year-over-year increases were Maine (10.1%), Connecticut (9.5%), and New Jersey (9.2%).

Change in the Top 10 Markets According to the Home Price Index
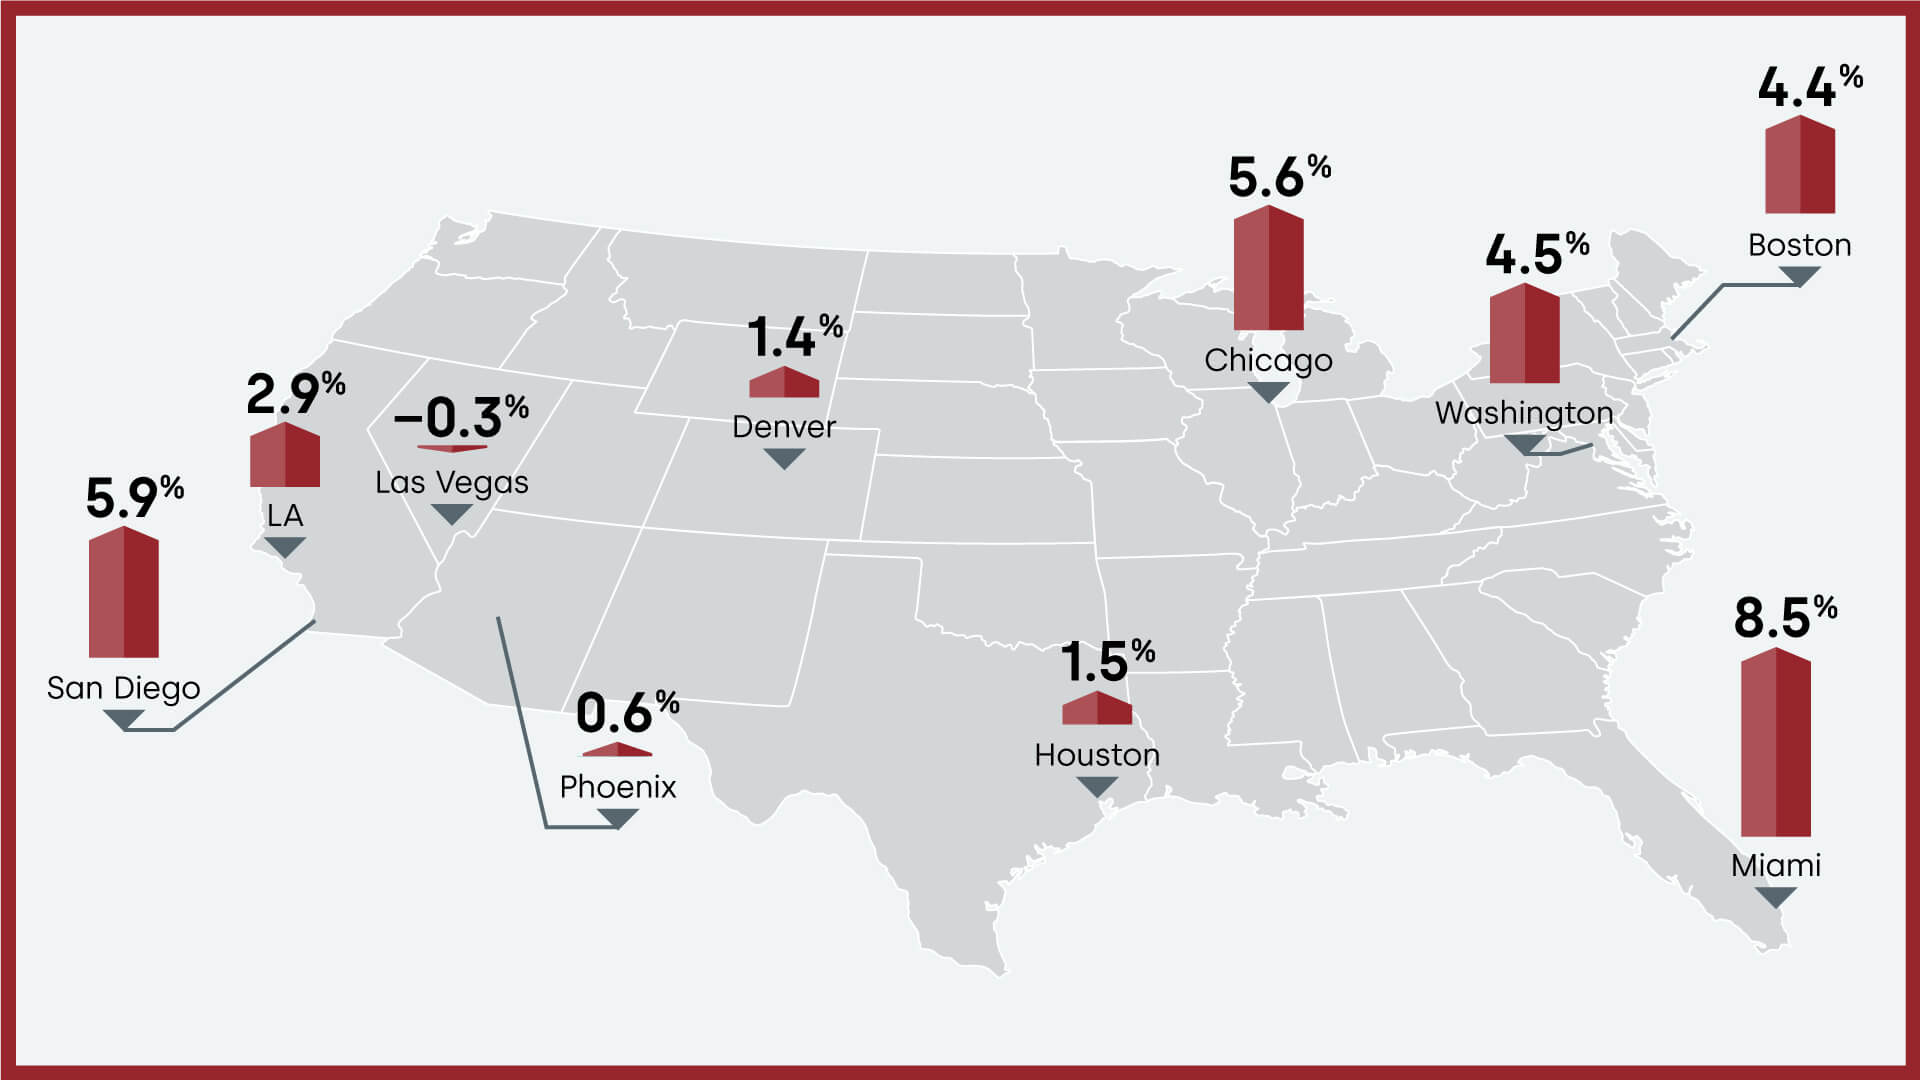
The CoreLogic Home Price Index provides measures for multiple market segments, known as tiers, based on property type, price, time between sales, loan type (conforming vs. non-conforming), and distressed sales. Below is a snapshot of home price changes in major U.S. metropolitan areas in September, with Miami again recording the largest gain at 8.5% year-over-year.

Markets to Watch: Top Markets at Risk of Decline in Home Prices
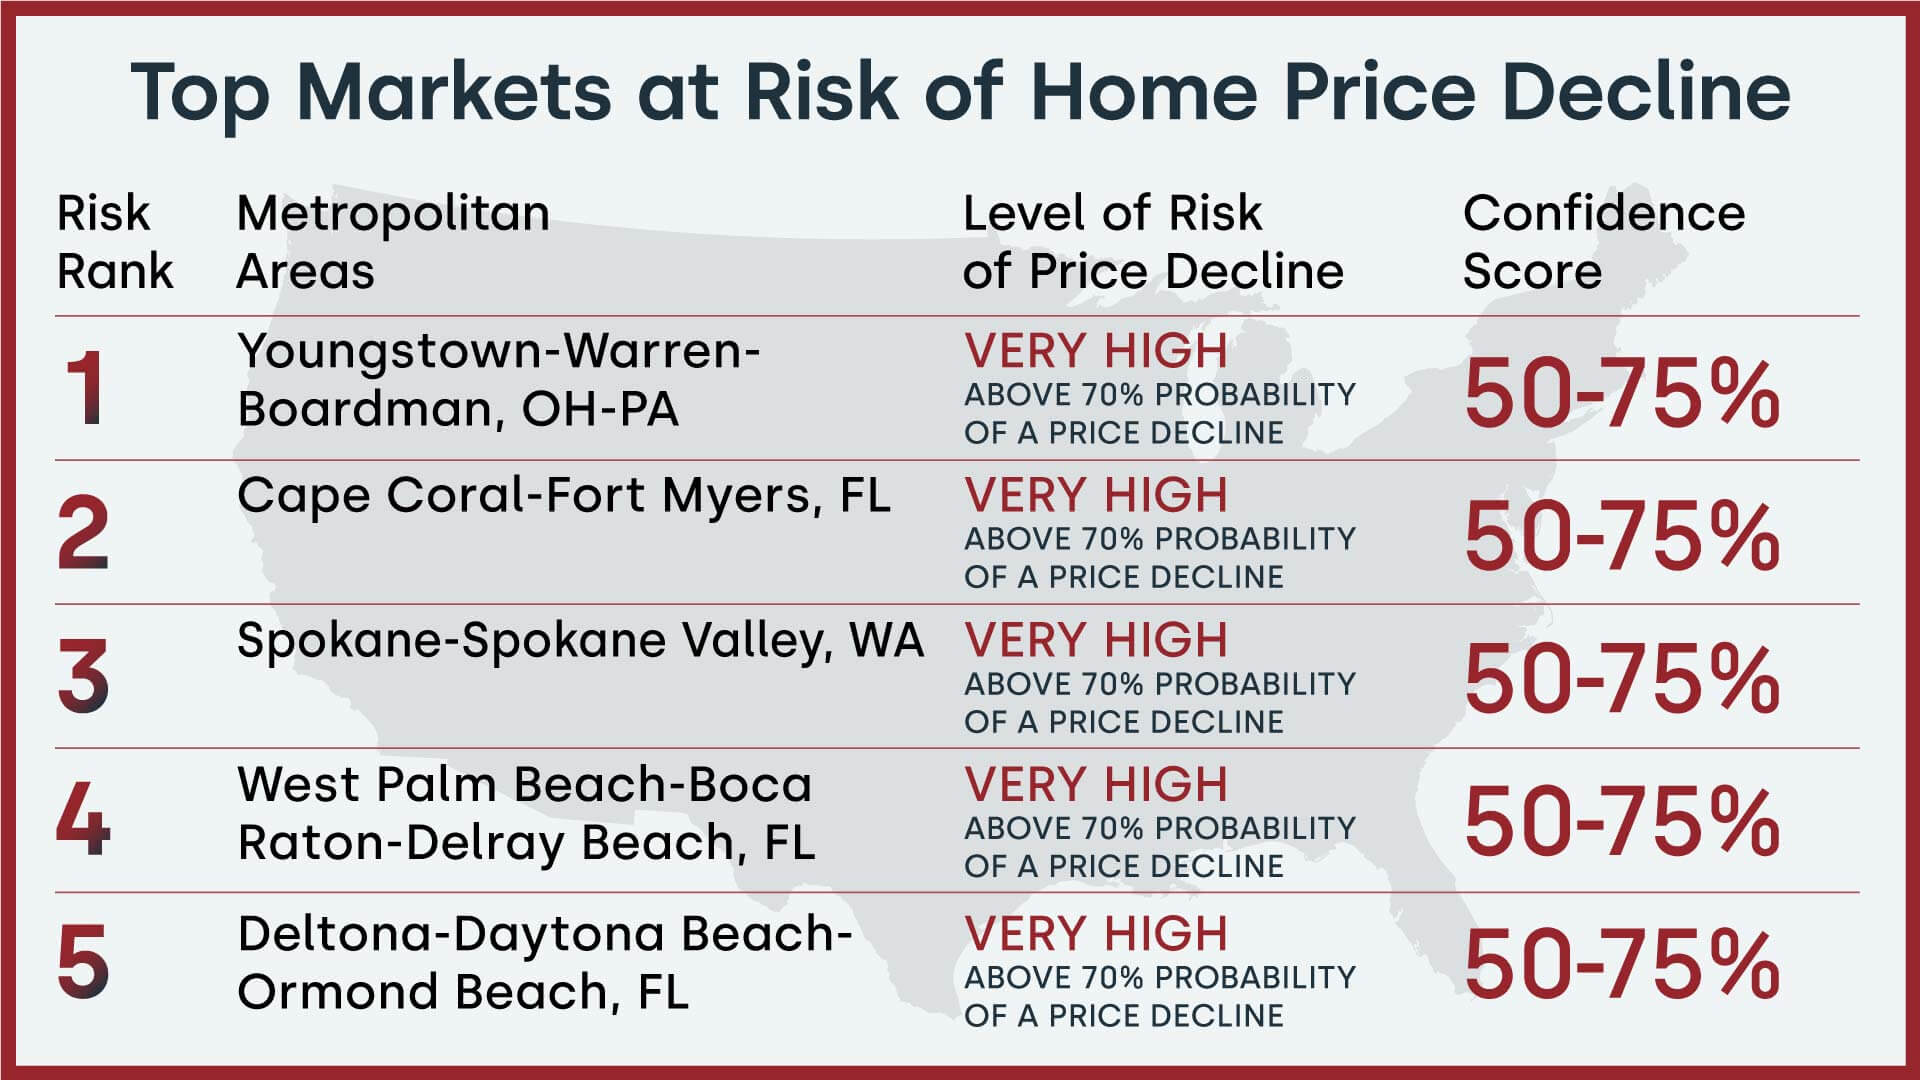
The CoreLogic Market Risk Indicator (MRI), a monthly update on the overall health of housing markets across the country, predicts that Youngstown-Warren-Boardman, OH-PA (probability greater than 70%) has a very high risk of a home price decline over the next 12 months. Cape Coral-Fort Myers, FL; Spokane-Spokane Valley, WA; West Palm Beach-Boca Raton-Delray Beach, FL; and Deltona-Daytona Beach-Ormond Beach, FL are also at very high risk of price declines.

