Miami Real Estate Market Report: July 2026

- By Miguel E. Hernandez
- Jul 20, 2026
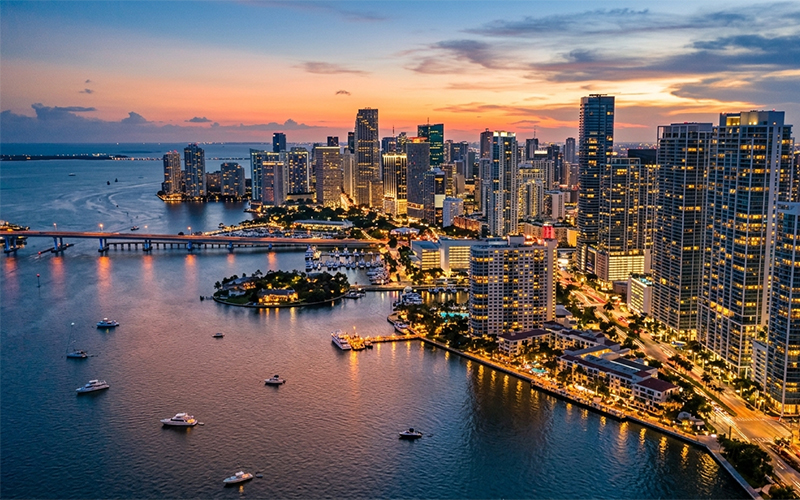
Miami Dade posted its best June in three years. Prices, inventory, mortgage rates, insurance, and a look by area: the full picture for July 2026.
Summary: Miami Dade closed June 2026 with its strongest performance in three years: 2,107 total transactions, a 14.3% year over year increase, and the tenth consecutive month of sales growth. The median price for single family homes rose 3.73% year over year to $695,000, while the median condo price fell 3.15% to $431,000, a contrast that reflects the two speed market we described in our earlier condo guides. Mortgage rates sit at 6.55% for a 30 year fixed loan (Freddie Mac, week of July 16), and the property insurance market keeps improving, with average Citizens rate cuts of 14.0% in Miami Dade. Areas like Doral and Hialeah are moving differently than the county average, confirming that no single local submarket behaves exactly the same. This report brings together the most recent official data available to understand where the market is heading in the second half of 2026.
Overall picture: the best June in three years
According to data from MIAMI REALTORS® + RWorld, the Miami MLS, and BeachesMLS, released on July 17, 2026, Miami Dade County recorded 2,107 total transactions in June, a 14.3% increase compared to the same month in 2025 and the tenth consecutive month of year over year sales growth.
| Indicator | June 2026 | Year over year change |
|---|---|---|
| Total sales | 2,107 transactions | +14.3% |
| Single family home sales | +16.8% | |
| Condominium sales | +11.9% | |
| Sales of $1 million or more | +29.1% | |
| Condo sales between $300K and $600K | +8.7% |
MIAMI REALTORS® + RWorld Chairman of the Board Alfredo Pujol attributed this performance to a combination of cash buyers, wealth migration into Miami, and sustained international demand, also boosted by the influx of visitors during the FIFA World Cup held in the city that month.
Prices: single family homes up, condos down
The most relevant data point of the month is the divergence between segments, something we as agents have been watching closely since Florida's condominium reserve rules were tightened.
| Property type | June 2026 median price | Year over year change | Appreciation since 2011 |
|---|---|---|---|
| Single family home | $695,000 | +3.73% (from $670,000) | +302.4% (from $172,700) |
| Condominium | $431,000 | –3.15% (from $445,000) | +278% (from $113,800) |
Single family home prices in Miami Dade have risen in 172 of the last 175 months (more than 14 years), a streak that confirms this segment's resilience even in an environment of elevated mortgage rates. Condos, on the other hand, have held prices steady or rising in 165 of the last 181 months, but June marked a year over year decline that deserves context.
My critical read: why condo prices are falling while inventory is also falling
At first glance this looks contradictory. If condo inventory is declining year over year, you would expect upward price pressure, not downward. My interpretation, after reviewing the composition of this month's sales, points to a shift in mix rather than a broad loss of real value.
- The fastest growing sales segment was precisely condos priced between $300,000 and $600,000 (+8.7%), a lower mid price range that, by representing a larger share of total transactions, pulls the median price down even as luxury buildings keep appreciating.
- This is consistent with the two tier market we described in our seller's guide: older buildings with insufficient reserves or pending special assessments are selling at lower prices to move, while healthy buildings and new projects hold or increase their value.
- In other words, it is not that condos in Miami are broadly worth less. It is that more units from the reserve pressured segment are selling today, and fewer from the luxury segment, which distorts the monthly average.
Inventory and time on market
Inventory continues to show a sharp gap between segments. Mid 2026 market tracking reports put single family home supply in Florida between 4.7 and 6.4 months depending on the area (considered balanced territory), while condo supply remains much higher, in a range close to 12 to 13 months in several statewide measures, a direct reflection of oversupply in older buildings that are now more expensive to finance and insure.
| Segment | Approximate months of inventory (mid 2026) | Interpretation |
|---|---|---|
| Single family homes | ~4.7 to 6.4 months | Balanced market, favorable for both buyers and sellers |
| Condominiums | ~12 to 13 months | Oversupply, especially in buildings with insufficient reserves |
A look by area: Doral and Hialeah versus the county average
The county average hides very real differences between submarkets. Doral and Hialeah are good examples of how the western Miami Dade corridor moves with its own dynamics.
| Indicator | Doral | Hialeah | Miami Dade (county) |
|---|---|---|---|
| Approximate median price | $545K to $549K (list price) | $444K to $475K | $695K (single family) / $431K (condo) |
| Price per square foot trend | Down ~6% year over year | Down ~3% year over year | Divergent by segment |
| Inventory | Moderate, ~99 to 102 days on market | Very tight, ~2.25 months of supply in some segments | ~5 to 6 months (single family), ~12 to 13 months (condo) |
| Dominant buyer profile | Families relocating from Miami, international buyers | Workforce housing buyers, rental investors | Mixed, with strong cash buyer presence |
Critical take: Doral shows a Zillow home value index up 7.5% year over year, while at the same time list price and price per square foot show a moderate decline. This is not a real contradiction but the difference between the estimated value of the total housing stock and the recent behavior of sellers adjusting expectations after years of very aggressive increases, a pace correction rather than a loss of underlying value. Hialeah, on the other hand, combines moderating prices with extremely tight inventory, keeping real competition among buyers for entry level properties, a pattern typical of a workforce housing market where demand stays high but new supply does not grow at the same pace as in areas with more active development like Doral.
Mortgage rates: stable but above 6.5%
According to Freddie Mac, the average rate for a 30 year fixed loan stood at 6.55% during the week of July 16, 2026, a slight increase from the previous week (6.49%) but below the level from a year ago (6.75%). The 15 year rate stood at 5.93%.
- Financing cost remains the main constraint for leveraged buyers, though the 0.20 percentage point year over year improvement represents real relief compared to 2025.
- Freddie Mac itself noted that while purchase application demand has weakened recently, overall affordability is improving thanks to rising available inventory.
- For condo buyers, remember that starting August 3, 2026, the new Fannie Mae and Freddie Mac financial review rules we covered in our financing guide take effect, which can affect closing timelines regardless of the rate level.
Property insurance: the most significant improvement of the year
| Indicator | 2026 data |
|---|---|
| Average Citizens rate cut in Miami Dade | 14.0%, starting spring 2026 |
| Average Citizens rate cut statewide | 8.7% |
| New private insurers in Florida since the 2022 and 2023 reforms | 17 or more |
This improvement directly lowers the total cost of ownership, a factor that had been pressuring both single family home affordability and the financial health of condo associations.
The luxury segment keeps leading
- Sales of $1 million or more rose 29.1% year over year in June, the fastest growing category of the month.
- Coconut Grove posted a 37.9% increase in its median sale price in the first quarter of 2026 (up to $3.0 million) and a price per square foot of $1,087, a 17.6% year over year increase.
- Coral Gables kept its price per square foot essentially flat at $925, a sign of a high value market holding steady without disruption.
- Miami ranks among the most active markets nationally for sales of $10 million or more, a segment that depends little on mortgage financing and is therefore less sensitive to current rates.
Regional comparison: Miami Dade vs. Broward
| Indicator | Miami Dade | Broward |
|---|---|---|
| Median single family price | $695,000 (+3.73%) | $645,000 (+2.39%) |
| Total sales growth | +14.3% | +21.1% |
| Growth in $1M+ sales | +29.1% | +35% |
What to watch in the second half of 2026
- If mortgage rates hold near 6.5%, the single family segment will likely keep showing the strength seen in June, supported by buyers with solid purchasing power.
- The condo market will likely remain split between healthy buildings, which will probably hold or increase their value, and at risk buildings, which will keep pulling the overall median price down even though that does not represent a real value loss for every owner.
- The start of the Fannie Mae and Freddie Mac Full Review on August 3 could trigger a temporary rush of closings before that date, followed by longer approval times for condos with incomplete documentation.
- Fast growing suburban areas like Doral could continue correcting their pace of appreciation, while entry level markets like Hialeah will likely keep facing demand pressure due to limited inventory.
What to do with this information
- If you're buying a single family home, today's market offers more balance than in recent years. Use our mortgage calculator to simulate your monthly payment at the current rate.
- If you're evaluating a condo, don't rely only on the county median price. Request the building's specific financial documentation, as we explain in our condo financing guide.
- If you're selling, understanding which category your building or specific submarket falls into is key to setting a realistic price. Check our seller's guide.
- If you're an investor, the luxury segment, pre-construction, and accessible markets like Hialeah offer different types of opportunity. Browse our pre-construction catalog.
Conclusion
July 2026 confirms a Miami market moving at several speeds at once: single family homes with solid demand at the county level, condos split between buildings that are appreciating and buildings absorbing the weight of the new reserve rules, and submarkets like Doral and Hialeah moving according to their own buyer profile and inventory. Understanding which specific area and segment you're buying or selling in matters more today than following any general average.
If you'd like a personalized read on how this data affects your area or your specific situation, let's talk. Schedule a free consultation with Miguel E. Hernández.